

What You Can Actually Do With OpenTrace Africa - Ask ADZA
Most people don’t come to this site asking “what is federated agricultural intelligence infrastructure.” They come asking something much more specific: where should we expand, why did this price move, how exposed are we this season. This page starts there.
The scenarios below are organised around the real questions people bring to us, not around which category you fall into. If you see your own question here, that’s the point.
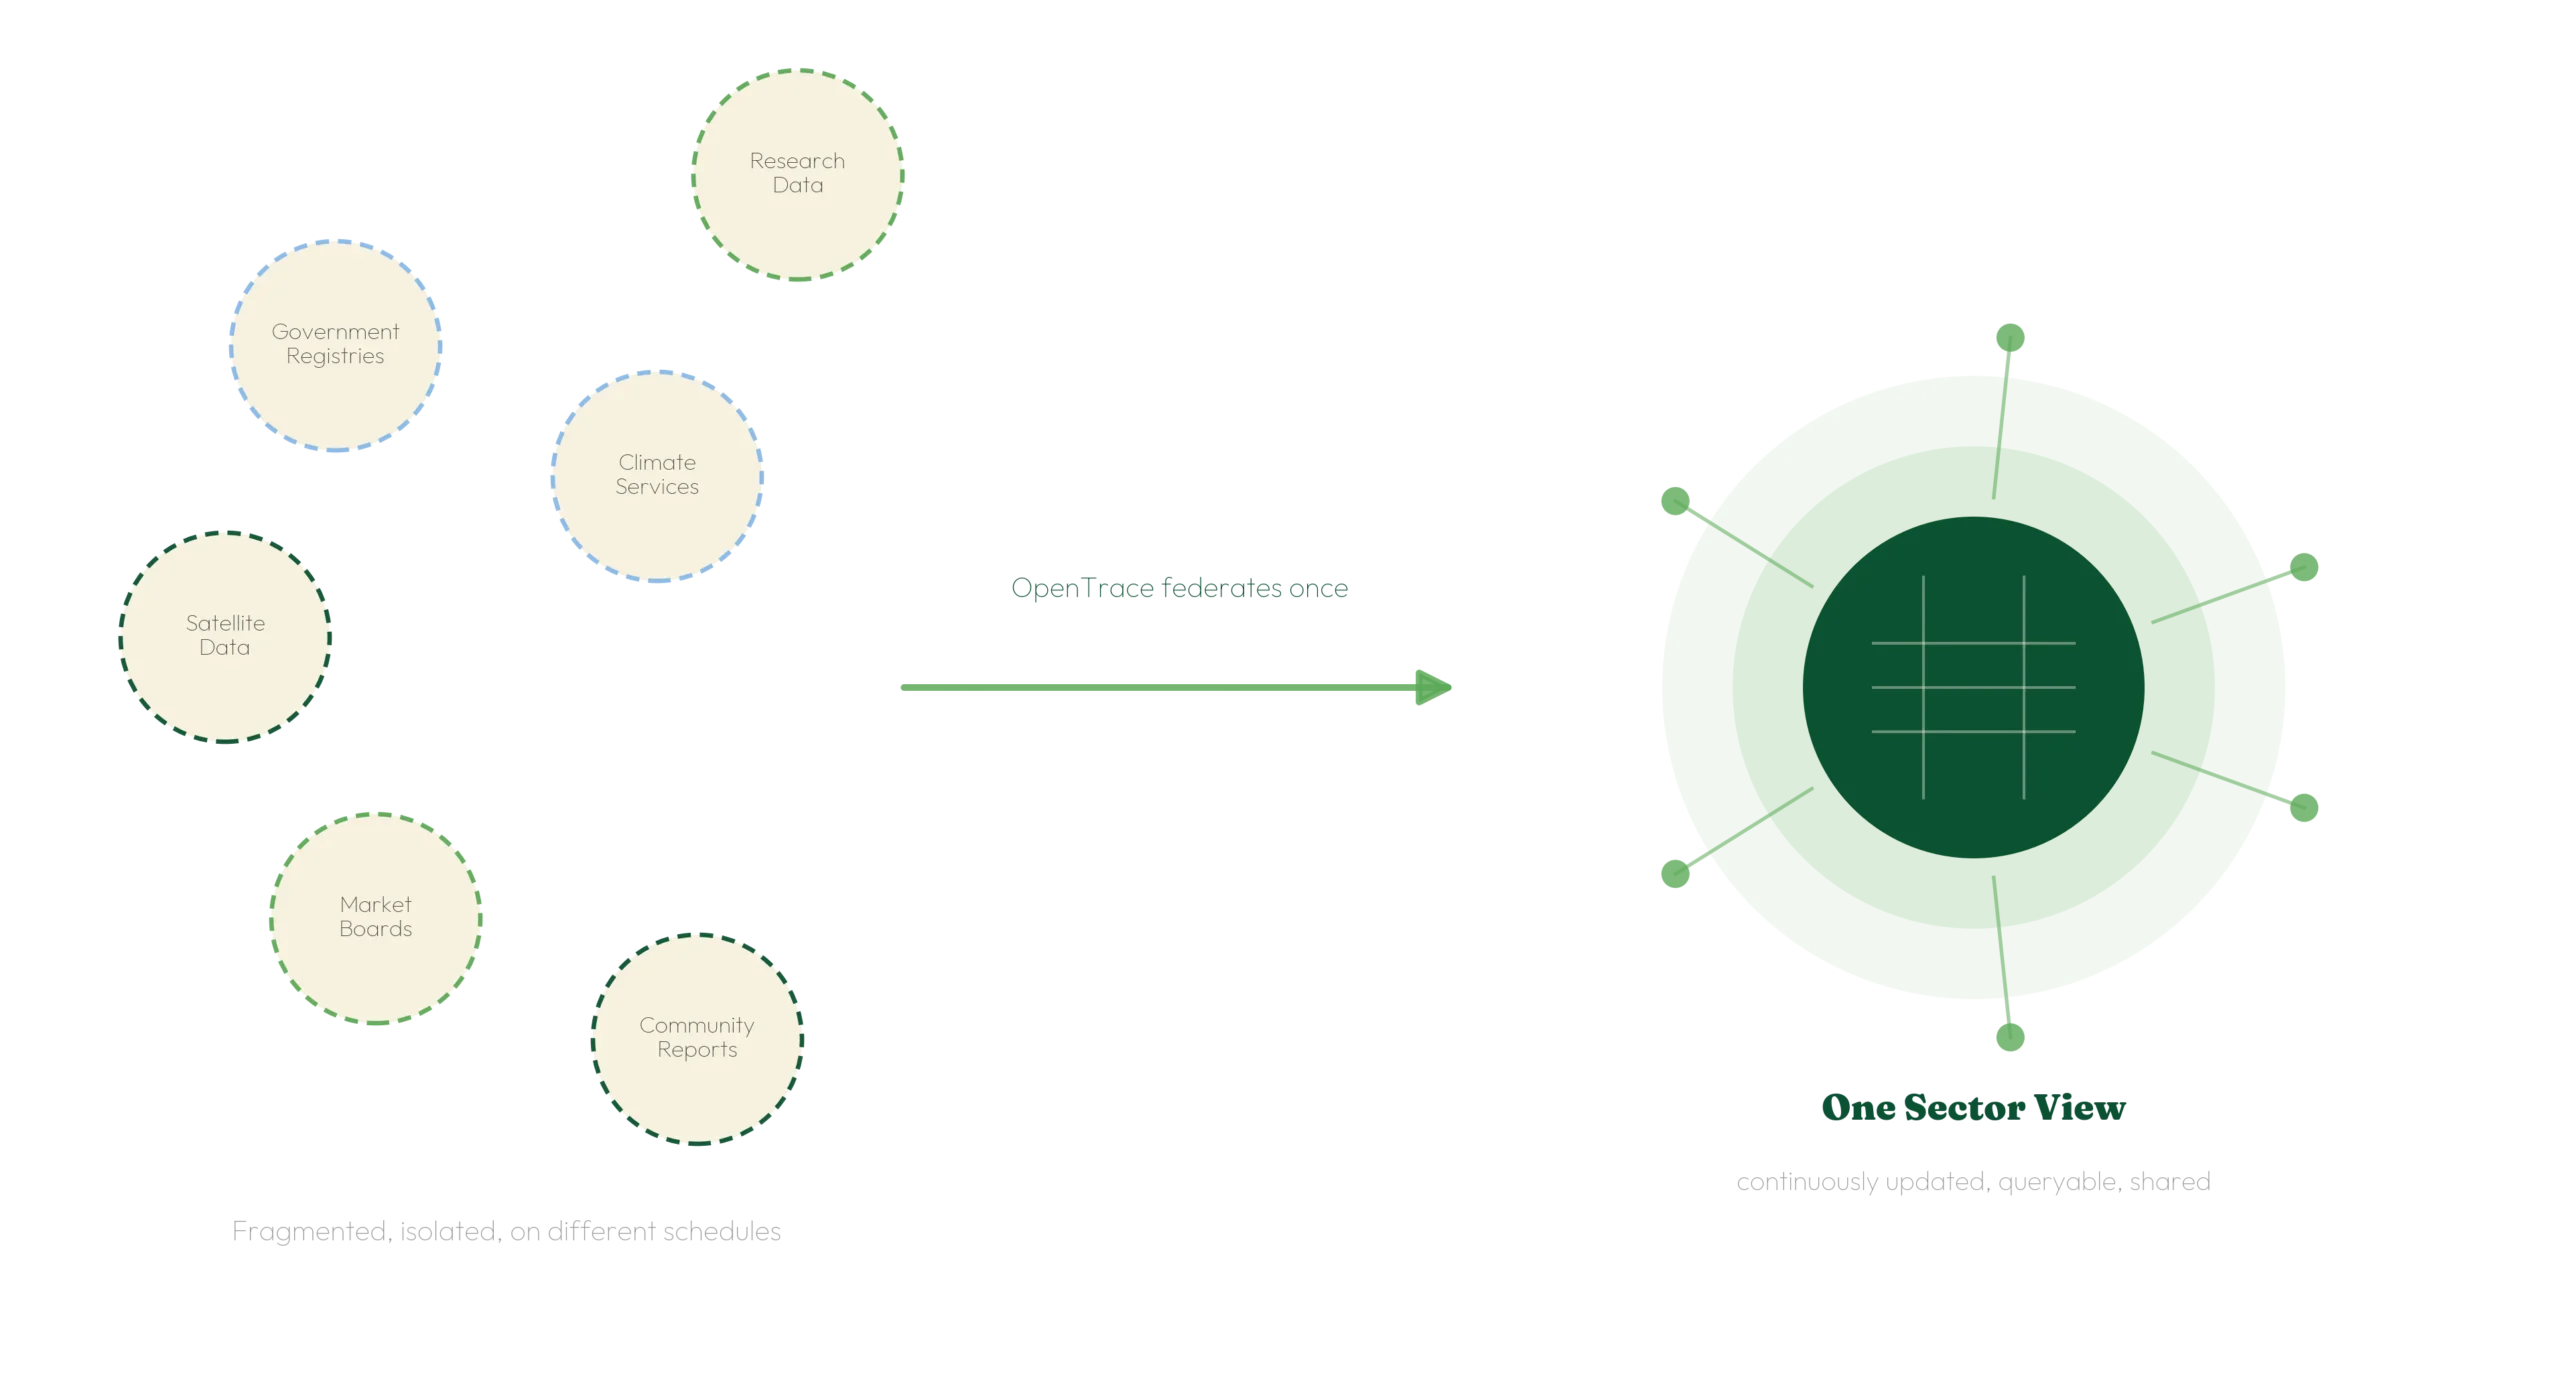
Why One Sector View Changes What's Possible
The reason every question on this page is answerable in one place is worth making explicit, not just asserted. Understanding a sector well enough to make a real decision usually means pulling together government registries, satellite data, market board records, climate services, and community reports, five or six sources, each in its own format, updated on its own schedule, often not talking to each other at all.
OpenTrace does that federation once. Every use case below draws on the same continuously updated, queryable view of the sector, not a fresh manual assembly each time the question changes. That’s what makes it possible to move from “I have five reports” to “I have one answer” in minutes instead of weeks.
Market & Expansion Opportunity
“Where should we expand, and which crops or regions are the real opportunity?”
Production trends, farmer demand signals, input use patterns, and the wider economic factors that shape where demand is actually heading, brought together instead of gathered one dataset at a time.
Production & Yield Trends
“How is production changing, and what's actually driving it?”
Yield trends alongside the climate variability behind them, with gaps in sparse regions closed by mirroring real seasonal patterns, not left blank or guessed at.
Price & Market Movement
“How are prices moving, and how does that compare to what's actually happening on the ground?”
Market prices set against real production levels, climate conditions, and trade flows, so a price move can be explained, not just observed.
Climate & Risk Exposure
“How exposed are we to this season's climate and production risk?”
Forward-looking climate and production signals, delivered as a confidence-banded range tied to real historical analogues, never a single number standing in for certainty.
Programme Targeting & Impact
“Where is the need greatest, and is our intervention actually working?”
Community-level signals and reconstructed local data, giving programme teams a continuously updated picture instead of a periodic snapshot.
Policy & Resource Planning
“Where should resources go, and what's the evidence behind that decision?”
Ministry, regional, and satellite data federated into one comparable view, with confidence signals attached, so allocation decisions rest on evidence rather than whichever report arrived most recently.
TYPICALLY ASKED BY:
Local, Practical Guidance
“What's happening with rainfall, yields, and prices near me, right now?”
The same underlying intelligence, delivered in plain language on WhatsApp or USSD, no dashboard, no technical query, and no reliable internet connection required.
TYPICALLY ASKED BY:
See It Against Your Own Question
If your question doesn’t map neatly onto any of the above, that’s fine, it usually means it’s worth a direct conversation rather than another page of the website.